Technical Analysis for Beginners
Understanding the Basics of Technical Analysis
Last updated: Feb 5, 2024
Author: Nathan Nobert
What is Technical Analysis?
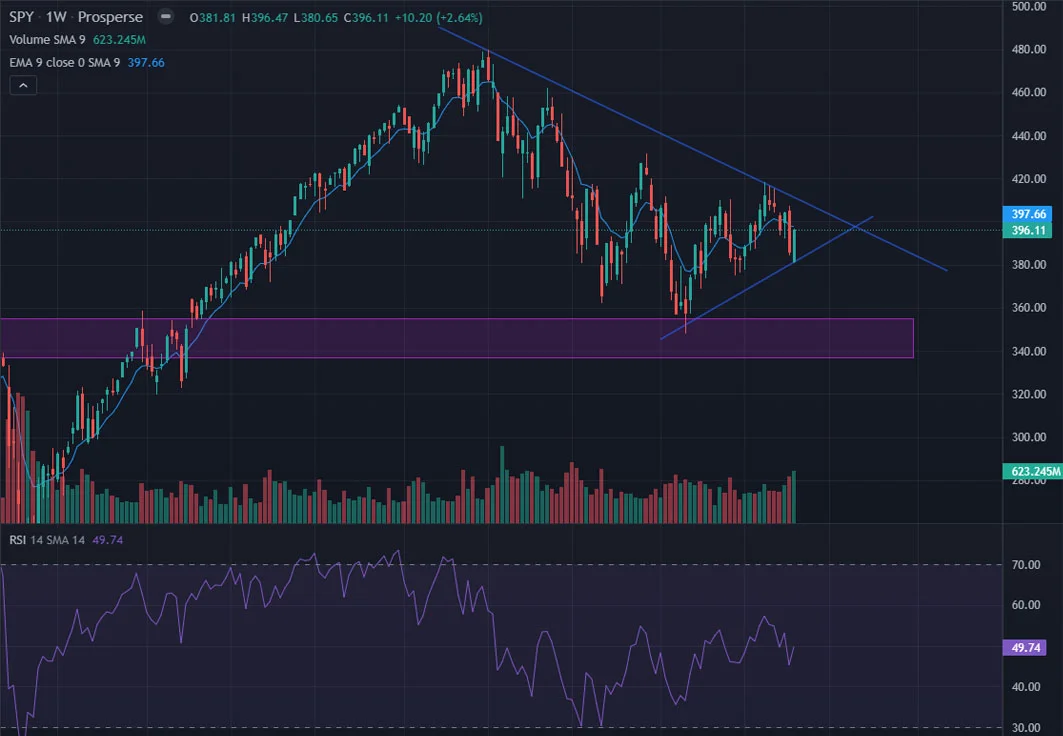
Have you ever watched the stock market with a mix of fascination and bewilderment, wondering how seasoned traders manage to navigate its twists and turns with seemingly uncanny foresight? If so, you're not alone. Many beginners and even experienced traders constantly seek the secret behind making informed, strategic decisions in the fast-paced world of stock trading. This is where the art and science of technical analysis comes into play, offering tools and techniques that could be the key to unlocking your trading potential.
Technical analysis is an essential tool for stock market traders looking to predict future price movements based on historical patterns and trends. It's a valuable method that can help traders make informed decisions by analyzing statistical data and identifying potential opportunities.Today, we will dive deep into the concept of technical analysis, its common indicators, and how using stock scanners can enhance your trading experience.
The main goal of Technical Analysis is to identify patterns and trends in market data, in order to make informed investment decisions. We will cover the basics of Technical Analysis at a high level, while including, indicators, trend lines, support and resistance levels, and other key concepts that can help you improve your trading skills.
While fundamental analysis delves into a company's value to forecast stock movements by examining financial health and market position, technical analysis steers towards analyzing past price actions and volume to spot trading prospects. Each approach offers unique insights, yet they cater to different aspects of market analysis. For a closer look at fundamental analysis, check out our detailed exploration
Historical Context of Technical Analysis
Historical Context of Technical Analysis Technical analysis, with its roots tracing back to the rice markets of 18th century Japan, has evolved significantly over the centuries. Initially, traders relied on basic chart patterns and price movements to make trading decisions.
The practice gained prominence in the West with Charles Dow's theory in the late 19th century, laying the groundwork for what would become a cornerstone of modern trading strategies. Over the years, technical analysis has grown in complexity and sophistication, incorporating statistical and mathematical models to analyze market trends.
This evolution from simple chart observations to complex analytical methods reflects the adaptive nature of trading strategies to the ever-changing market environments.
Modern Relevance of Technical Analysis
In today's digital age, the relevance of technical analysis has been magnified by the advent of advanced software and trading platforms. These tools have democratized access to technical indicators and computational analyses that were once the domain of professional traders with deep mathematical knowledge.
Modern platforms offer real-time data, sophisticated charting tools, and automated trading algorithms, making it easier for beginners to navigate and apply technical analysis in their trading strategies. This integration of technology not only simplifies the learning curve for newcomers but also enhances the precision and efficiency of market analysis, making it an indispensable tool in the arsenal of today's traders.
Why Technical Analysis Works
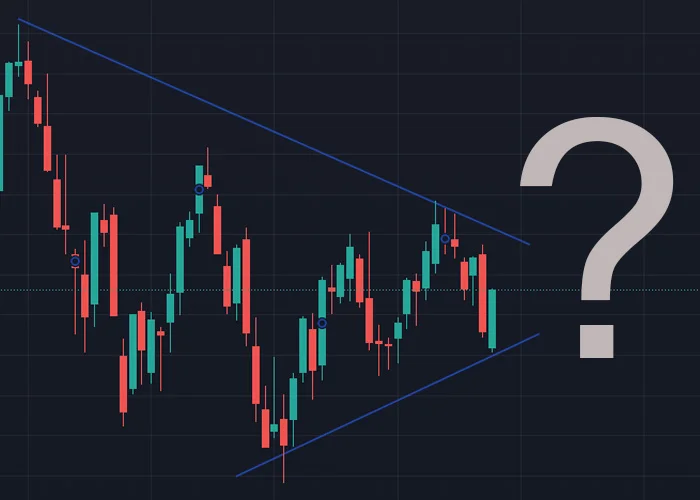
Technical analysis works because it takes into account the psychological factors that drive market movements. The patterns and trends observed in the historical data are a reflection of the collective behavior of market participants. By analyzing this data, technical analysts can identify recurring patterns that suggest how the market might behave in the future.
Before diving into the intricacies of Technical Analysis, it is crucial to understand its core principles. Technical Analysis is not a magic wand that can predict market movements. Instead, it is a tool that can help traders make informed decisions based on historical price data. Keep in mind that the goal of a trader is to take advantage of the information given to make an educated prediction, everyone will apply technical analysis differently.
Core Principles & Concepts
Support and resistance are two important concepts in Technical Analysis that are based on price action. The basic idea behind these concepts is that the price of an asset tends to stop and reverse direction at certain levels that have acted as barriers in the past.
Support refers to a level in the price of an asset where there is buying pressure that prevents the price from falling further. This level acts as a floor beneath the price, providing a support that helps to keep the price from dropping too low. When the price approaches this level, buyers are more likely to step in and buy the asset, which can cause the price to bounce back up.
Resistance, on the other hand, refers to a level in the price of an asset where there is selling pressure that prevents the price from rising further. This level acts as a ceiling above the price, providing a resistance that helps to keep the price from rising too high. When the price approaches this level, sellers are more likely to step in and sell the asset, which can cause the price to drop back down.
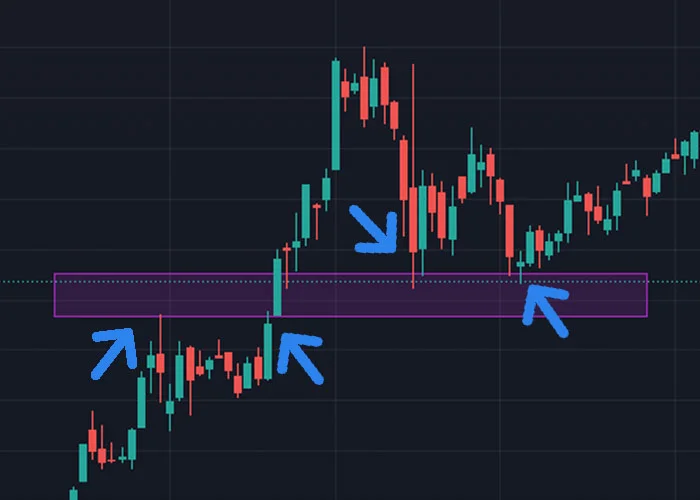
The above image displays an area in which a resistance level was identified. However the stock broke through this resistance level and continued to rise. We were then able to identify a new lower boundary of a support where we think buyers may jump in. In the above case it bounced off this level twice and moved up. This is a good example of how support and resistance levels can be used to identify potential buy and sell signals, but also proof that these levels will be broken through at some point.
The concepts of support and resistance are core to Technical Analysis. By analyzing price charts and identifying key support and resistance levels, traders can make informed decisions about when to enter or exit a position. Additionally, support and resistance levels can also be used to set stop loss and take profit levels, which can help traders manage risk and maximize profits.
Our education hub goes over more technical analysis concepts such as trend lines, moving averages, and volatility. You can read more
Common Indicators Used in Technical Analysis
Indicators are tools used in Technical Analysis to provide additional information about the price and volume movements of a particular asset. These indicators are designed to help traders identify potential buy and sell signals, trend reversals, and other important patterns in the data. They can be based on a variety of mathematical calculations and statistical models, and can be customized based on the specific needs and preferences of individual traders. Let's review a couple common indicators and what they can tell us about the market.
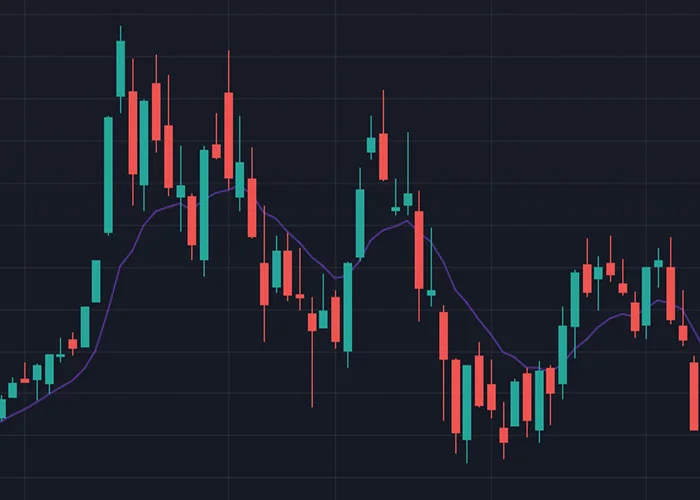
Moving Averages: Moving averages are one of the most popular and widely-used technical indicators. They help identify trends by smoothing out price fluctuations, making it easier to see the overall direction. Common types include Simple Moving Average (SMA) and Exponential Moving Average (EMA). Below is an example of SMA being applied, the purple line is the indicator.
Relative Strength Index (RSI): The RSI is an indicator that measures the speed and change of price movements, ranging from 0 to 100. Higher values indicate a higher buy pressure and momentum, and lower values indicate sell pressure or lack of interest in a stock. It can help identify overbought or oversold conditions, signaling potential reversals.
Stock scanners, such as
Prosperse , can be used to notify you when a stock reaches a certain RSI level, commonly below 30 or above 70. This can help you identify potential trading opportunities, and can also help you manage risk by setting stop loss levels.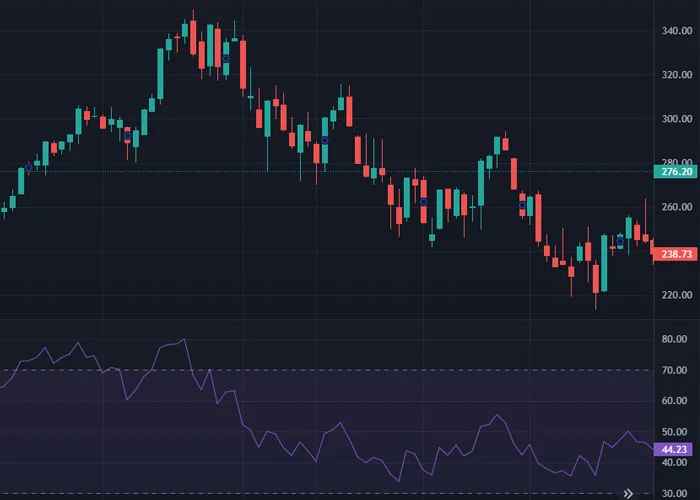
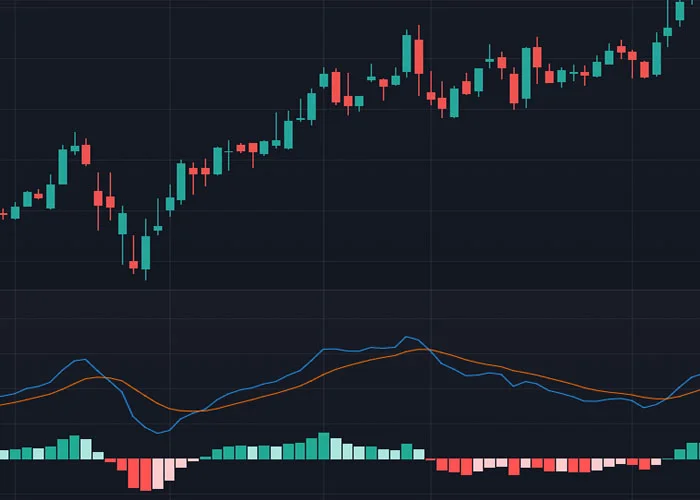
MACD (Moving Average Convergence Divergence): The MACD is a trend-following indicator that shows the relationship between two moving averages of a security's price. Common values for the MACD include 12, 26, and 9. The MACD line is the difference between the two moving averages, and the signal line is a 9-day EMA of the MACD line. The MACD histogram is the difference between the MACD line and the signal line. In the image below, the blue line is the MACD line, and the orange line is the signal line.
When the MACD line crosses above the signal line, it is considered a bullish signal, indicating that the momentum of the asset is shifting to the upside. Conversely, when the MACD line crosses below the signal line, it is considered a bearish signal, indicating that the momentum of the asset is shifting to the downside.
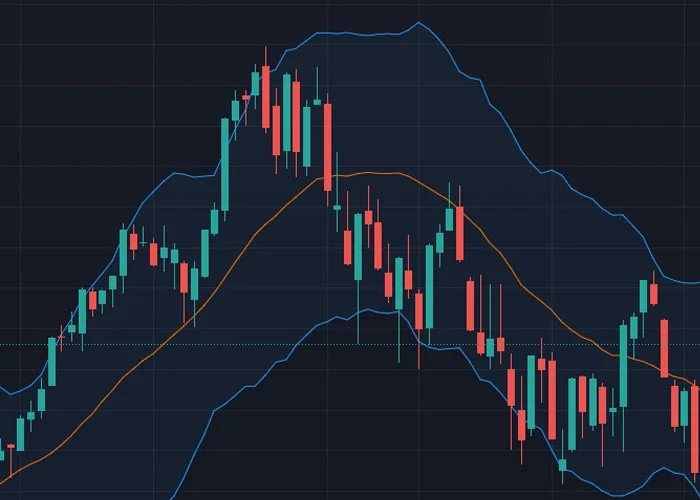
Bollinger Bands: These bands consist of a moving average with two standard deviations above and below it. The upper and lower bands are dynamic and move in response to changes in price volatility. When volatility is high, the bands widen, and when volatility is low, the bands contract. Bollinger Bands are designed to capture the majority of a security's price action, and they are commonly used to determine overbought and oversold conditions.
Traders often use Bollinger Bands to identify potential buy and sell signals. When the price of an asset moves above the upper band, it is considered overbought, and a sell signal may be generated. Conversely, when the price moves below the lower band, it is considered oversold, and a buy signal may be generated.
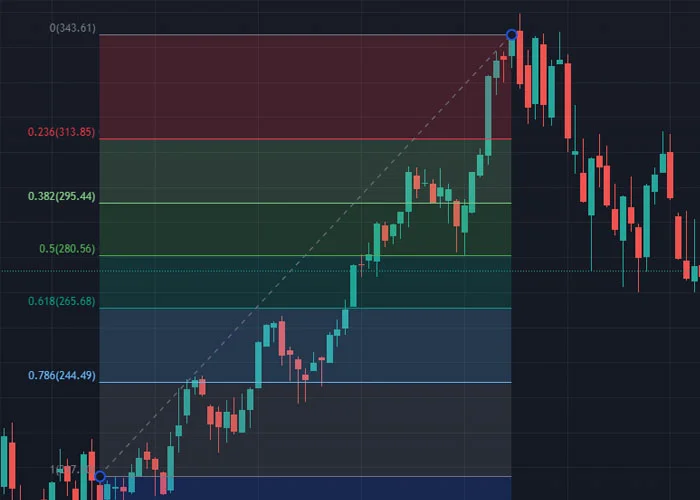
Fibonacci Retracements: This indicator is used to identify potential levels of support and resistance in a price chart. These levels are calculated by drawing horizontal lines at key levels based on the Fibonacci ratios of 23.6%, 38.2%, 50%, 61.8%, and 100%. These ratios represent the potential levels at which a retracement of a previous move could occur.
To use Fibonacci retracements, traders identify a significant move in the price of an asset and then draw the retracement levels from the high point to the low point (in the case of an uptrend) or from the low point to the high point (in the case of a downtrend). The retracement levels can then be used to identify potential areas of support and resistance where the price of the asset may reverse direction.
Integration with Modern Tools
The integration of stock scanners with modern trading platforms and mobile apps has revolutionized the way traders approach technical analysis, offering unparalleled convenience and access to real-time market analysis.
These advanced tools allow traders to sift through thousands of stocks, forex pairs, or cryptocurrencies in seconds, identifying potential trading opportunities that align with their strategies. By leveraging the power of cloud computing and data analytics, these platforms can process vast amounts of historical and live market data, presenting it in an easily digestible format.
This real-time capability ensures traders can make informed decisions swiftly, capitalizing on market movements as they happen. Moreover, the seamless experience across devices—from desktops to smartphones—means traders can stay alert to market changes and adjust their strategies on the go, ensuring they never miss a potential opportunity.
How Stock Scanners Are Used With Technical Analysis
Stock scanners are powerful tools that help traders find potential trading opportunities based on specific technical criteria. By using stock scanners, traders can:
Save time by filtering out stocks that don't meet their desired technical criteria.
Identify potential trade setups based on predefined technical indicators, such as moving average crossovers, RSI levels, or Bollinger Band breaches.
Customize their scans to align with their unique trading strategies and risk tolerance.
Prosperse offers an advanced, automated stock scanner that allows traders to scan for stocks based on technical indicators, such as the ones described above.
Create custom conditions and strategies, backtest them against historical data, and receive real-time alerts when a stock meets your criteria. The best way to use indicators is to find trends in the market, not rely on them for guaranteed success. By having alerts on indicators set for certain stocks that you are interested in can give you an idea of when the market may be reactiving in your favour.
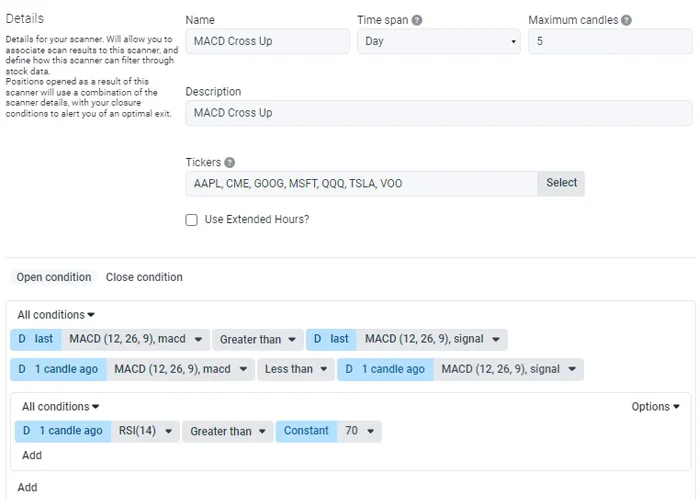
Below is an example of how you can create a stock scanner using Prosperse to run 24/7 on the selected tickers. This scanner will alert you when the MACD line crosses above the signal line, and when the RSI is above 70.
In summary, technical analysis is a method of evaluating the stock markets by analyzing trends and patterns, while not taking a large amount of consideration into the core fundamental values of the company or market. Traders can use various tools like charts, indicators, and mathematical calculations to identify potential buy and sell signals. By using stock scanners such as Prosperse, traders can automate this process and take action on potential buying opportunities.
Trending News

Yesterday, Coca-Cola Co (NYSE:KO) reported first-quarter FY24 sales growth of 3% year-on-year to $11...
Shivani Kumaresan
May 1, 2024

Smart Beta ETF report for QDEF
Zacks Equity Research
May 1, 2024

The S&P 500 rebounded by nearly 4% after a 7% pullback, but uncertainty remains about whether the co...
Victor Dergunov
Apr 30, 2024

Open online course provider Coursera Inc (NYSE:COUR) reported first-quarter FY24 quarterly sales of ...
Shivani Kumaresan
Apr 30, 2024
