How To Trade The Bullish Engulfing Pattern
A Guide & Case Study On Bullish Engulfing Candlesticks
Last updated: April 18, 2024
Author: Nathan Nobert
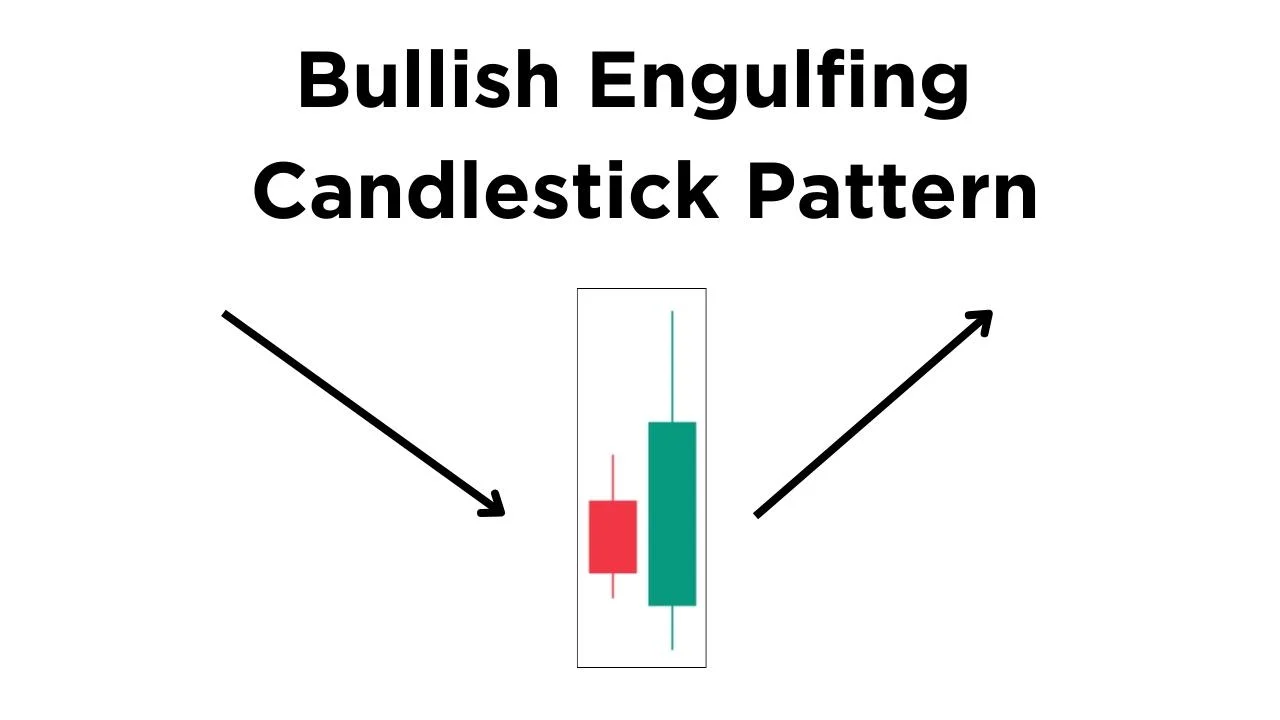
Ever wondered how traders seem to know just when a stock is about to go up? Meet the Bullish Engulfing Candlestick Pattern, your new best friend in trading!
Key Takeaways
- - How to Identify a bullish engulfing candle
- - Importance of the bullish engulfing candle in Technical Analysis
- - Risk Management and Confirmation
- - Case Study on Microsoft Stock
- - Tools, Indicators, and Scanners to master the Bullish Engulfing Pattern
By the end of this guide, you'll know why this pattern is a game-changer, how to spot it, and how to make it work for you. Plus, we'll look at real-life examples and tools you can use to make your trading life easier.
How to Identify a Bullish Engulfing Candle
The Two Candles: The first is a small red candle, followed by a larger green candle that completely engulfs the first. We prefer to analyze green candles that fully encompass the previous red candles wicks, to further increase the strength of the pattern.
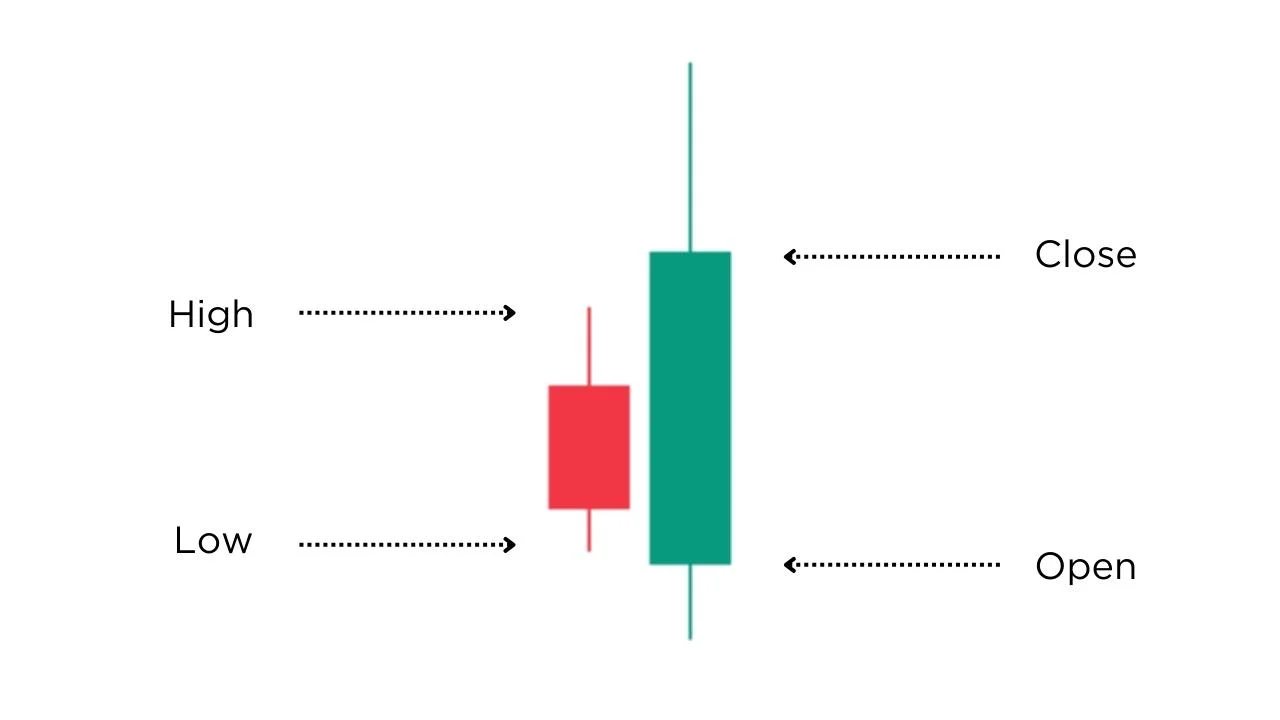
This occurs when the market was in a downtrend, but then had a strong buy pressure which erased the previous candles open price to set a new direction for the stock.
Importance of the Bullish Engulfing Candle in Technical Analysis
The Bullish Engulfing Pattern is a key indicator in technical analysis. It often signals a potential reversal in the market, making it a crucial pattern for traders to recognize. Think of it as a green light signaling that it might be a good time to buy.
This signal typically occurs near the bottom of a downtrend, signaling that a reversal may occur and buying pressure is up. Spotting one, in conjunction with other technical indicators could lead to a perfect entry.
Combining Fundamental and Technical Analysis
By taking a strong technical indicator, such as a Bullish Engulfing Pattern, and combining it with fundamental analysis, you can greatly increase your odds of success. This is because you are looking at the stock from multiple angles, not just one. You can read our guide on
Risk Management and Confirmation
Relying on one indicator won’t always provide the outcomes you may expect. Balancing a positive indicator with proper risk management is key to consistently winning trades. Here’s a short list to keep in mind when trading the Bullish Engulfing Pattern:
Steps to creating an effective budget:
- Set a stop loss and stick to it: Losing a trade isn’t fun, but the stop loss you exit a trade without further damage to your portfolio
- Use indicators to your advantage: Confirmation Indicators such as RSI, or a moving average used in conjunction can help you affirm the market is in a reversal and an uptrend will continue
- Backtest your strategy: Use tools to find historical Bullish Engulfing Patterns on different time spans and markets, find what works and what doesn’t.
- Paper Trading: Practice any new strategy or indicator without risking your portfolio until you know your strategy is working.
Microsoft Case Study
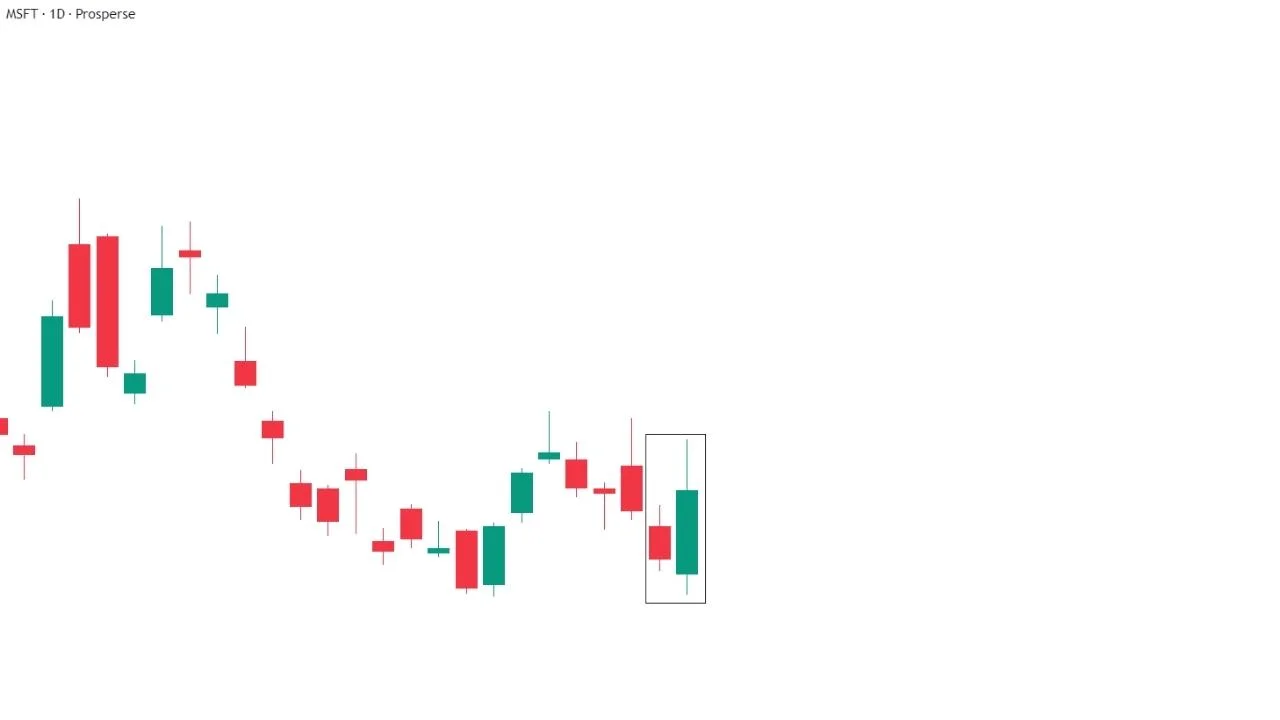
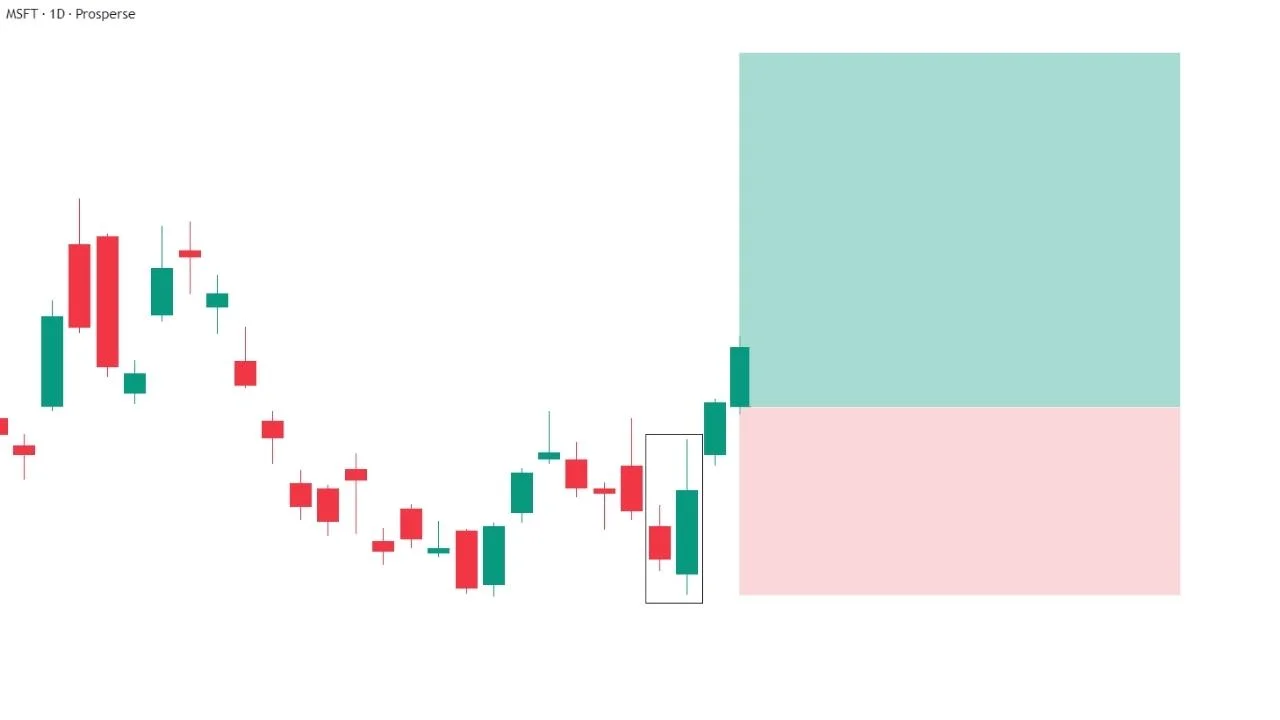
Here we will look at a Bullish Engulfing Candlestick on the MSFT stock that the Prosperse Scanner identified may have breakout potential.
Here is the Bullish Engulfing Candle being identified. We notice a few things about this such as the stock was previously coming from a small downtrend. This Bullish Engulfing Candle also has a low around a previous resistance level.
We wait for one more green candle to confirm the reversal, and then enter the trade on the open of the following candle. You can also enter the trade on this candle, depending on your risk tolerance and strategy. We waited until this candle completely closed to confirm the price movement.
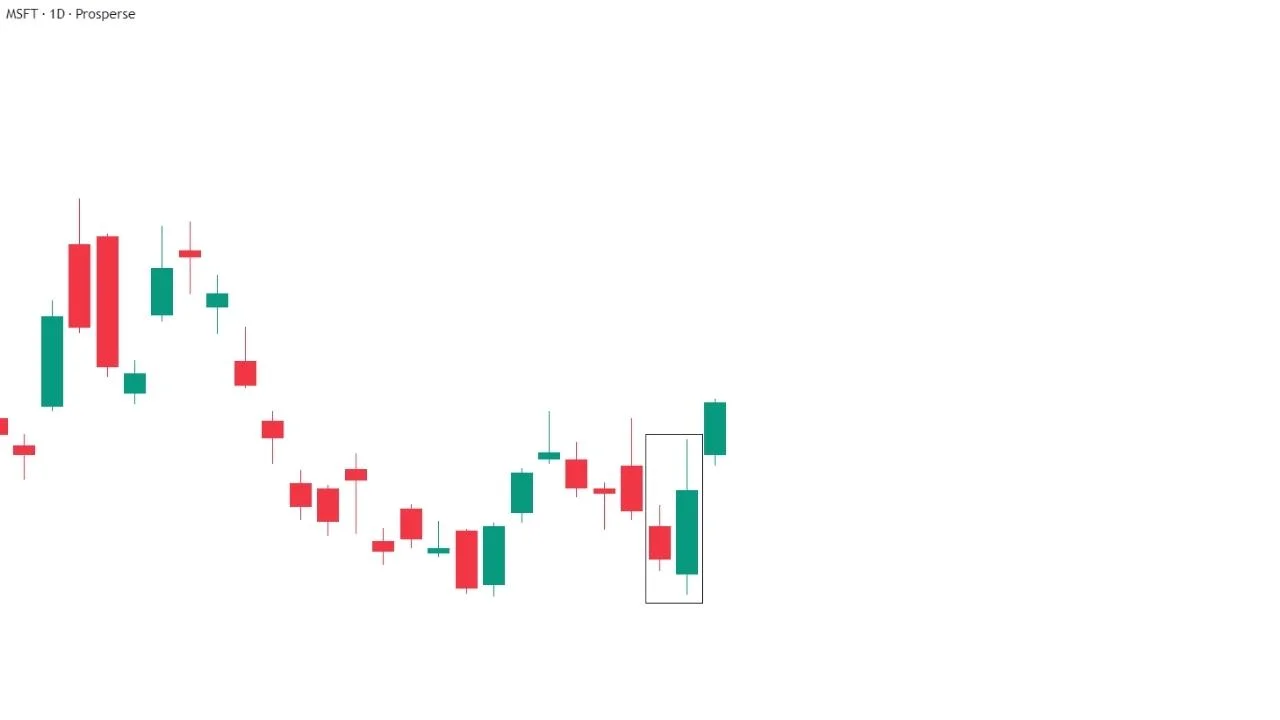
We set our stop loss just below the low of the Bullish Engulfing Candle. Our target is around a 2:1 risk to reward ratio, so we set our take profit a bit above the previous high in this case.
As we can see here, the trade remained in our favor the entire time, resulting in a 12% gain.
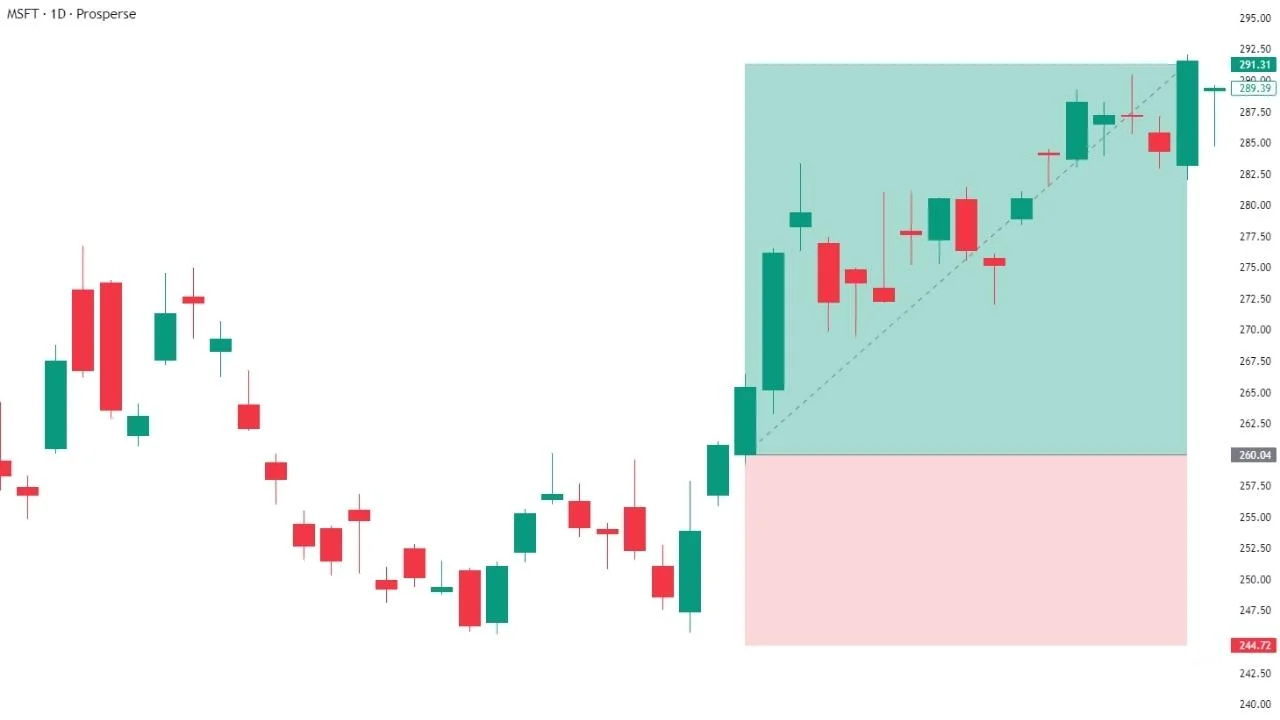
Not every trade will result in a win, but by using proper risk management and confirmation indicators, you set yourself up for success.
Tools, Indicators, and Scanners to master the Bullish Engulfing Pattern
Remember that using the Bullish Engulfing Pattern is like any other indicator, it’s a tool that can help identify and predict trends. It does not guarantee that the market will react in this specific way. This is why other indicators and tools should be used alongside this strategy.
Some common indicators that may suggest an uptrend will continue include RSI, MACD, EMA, and price action. Ensure the volume lines up with the price movements, and that your strategy suggests taking a position that will put you in a winning position.
The Bullish Engulfing Candle pattern can be extended and used in stock market scanners. We personally use a scanner to check for a downtrend, into a Bullish Engulfing Candle with a confirmation candle. This way no time is spent searching for setups like this one, our scanner finds hundreds of potential breakouts and we analyze based on those results.
You can use Bullish Engulfing Patterns in various strategies, including
Summary
A Bullish Engulfing Candlestick Pattern occurs when a green candle fully engulfs a red candle. This is a sign that the market may be reversing and starting an uptrend as buying pressure has overpowered the selling pressure.
This pattern is just one of many that you should learn and implement into your technical analysis. Combining the Bullish Engulfing Pattern with other indicators can greatly increase your success with trades.
Read more here
Trending News
No news available for this ticker. Please try again later, or another ticker
