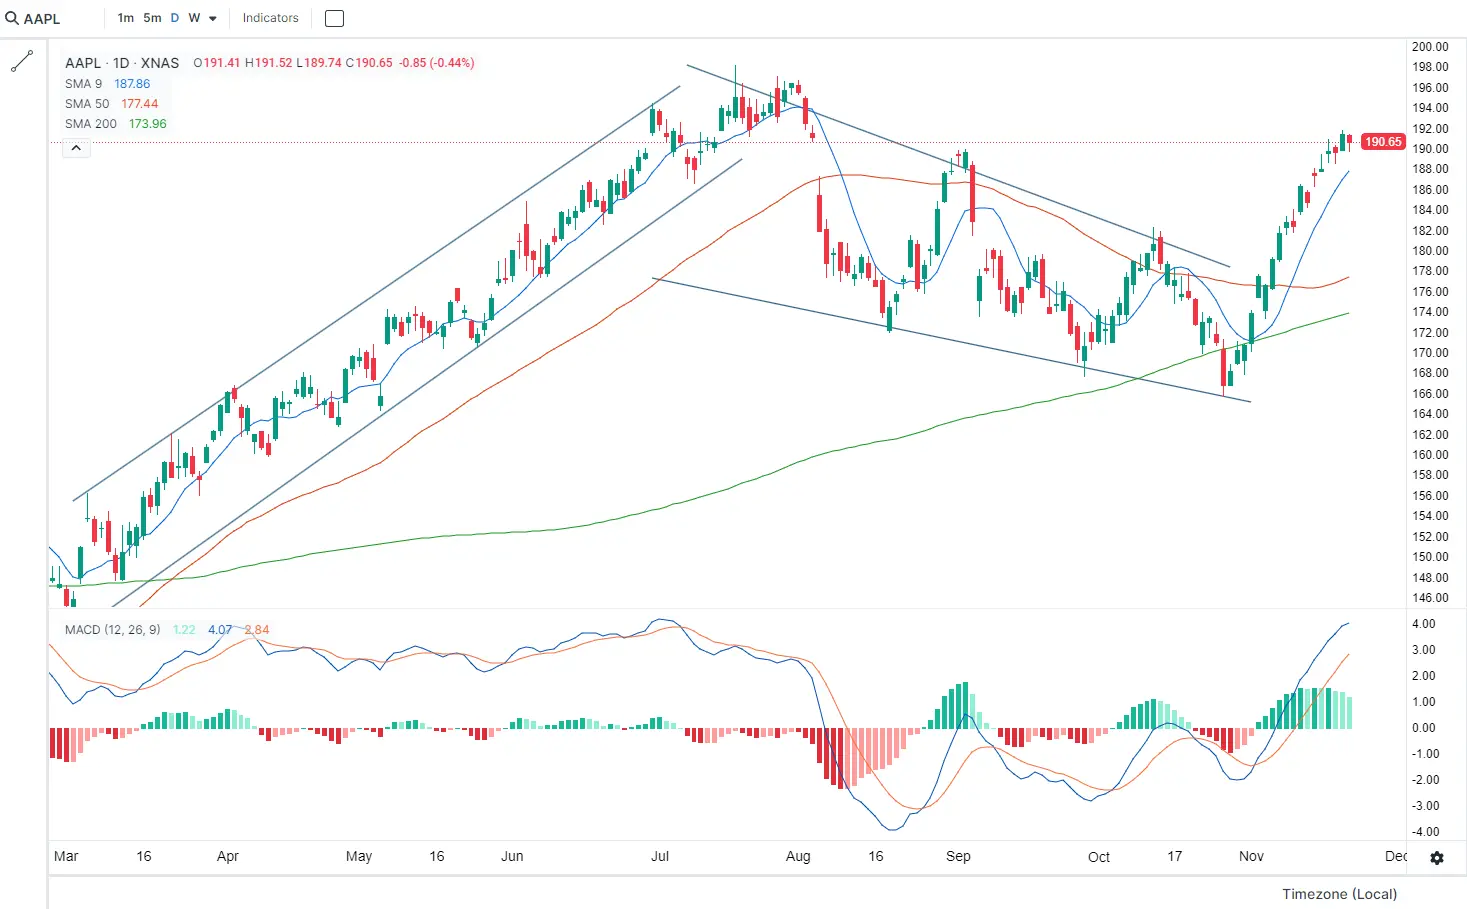
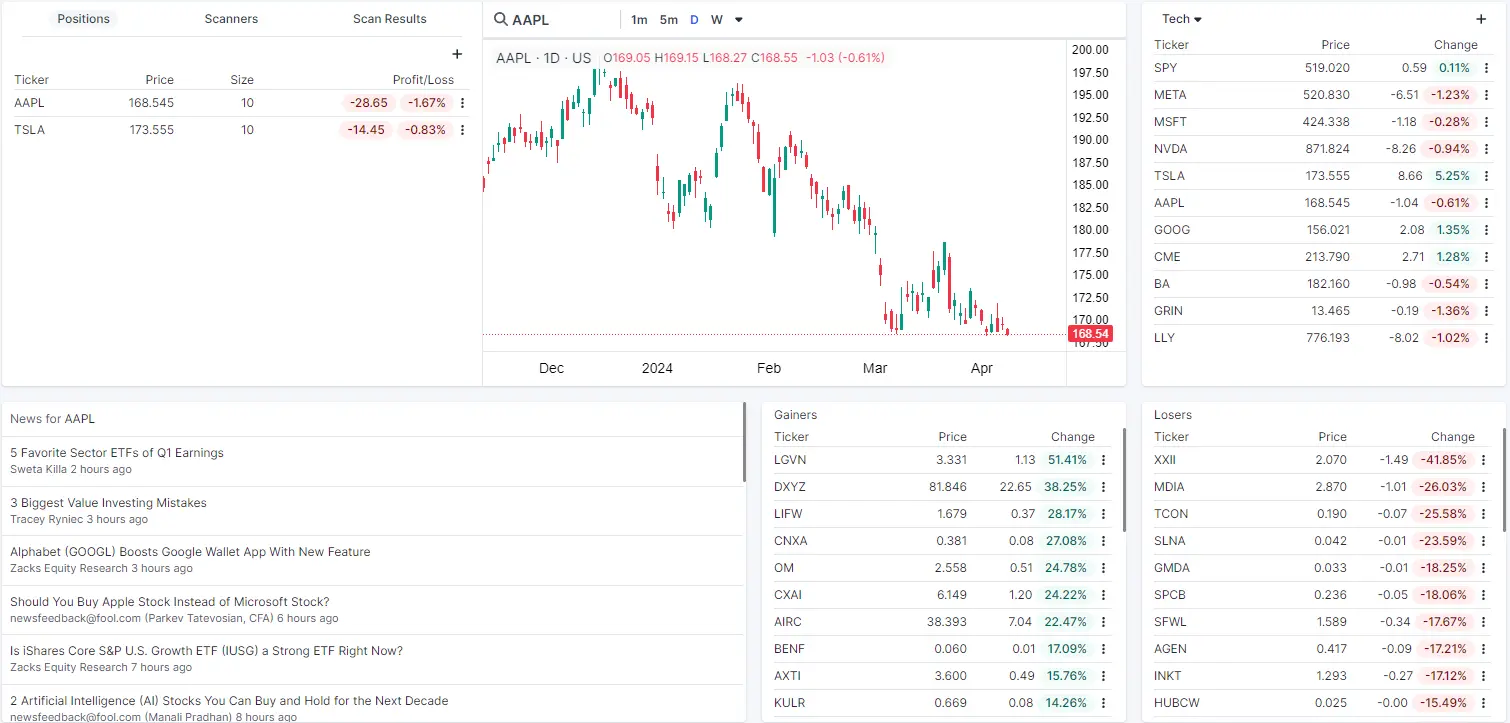
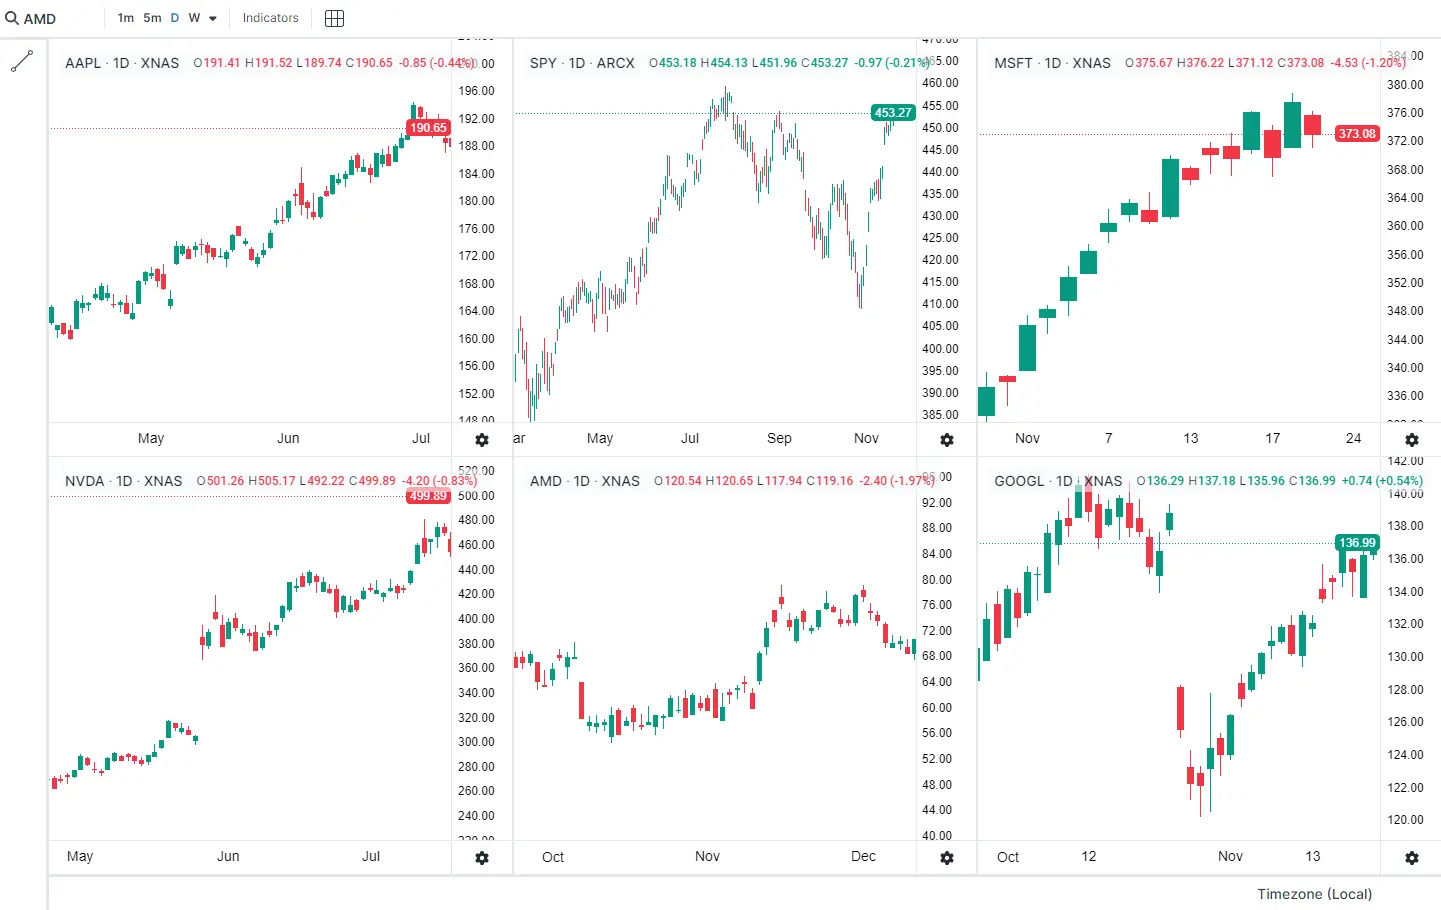
All-in-one Dashboard
Manage charting, scan results, watchlists, and live positions all in one place. View your positions and performance in real-time.
Frequently Asked Questions
How can a stock screener enhance my investment strategy?
A stock screener is an essential tool for investors, enabling you to filter and identify stocks based on specific criteria like market cap, industry, and financial metrics. This targeted approach saves time and helps you focus on potential high-reward opportunities that align with your investment strategy.
Is using a stock screener worth the investment?
Absolutely. Stock screeners provide significant value by allowing you to quickly sift through thousands of stocks to find those that meet your investment criteria. This not only enhances your decision-making process but also helps in managing risk and uncovering hidden gems in the market.
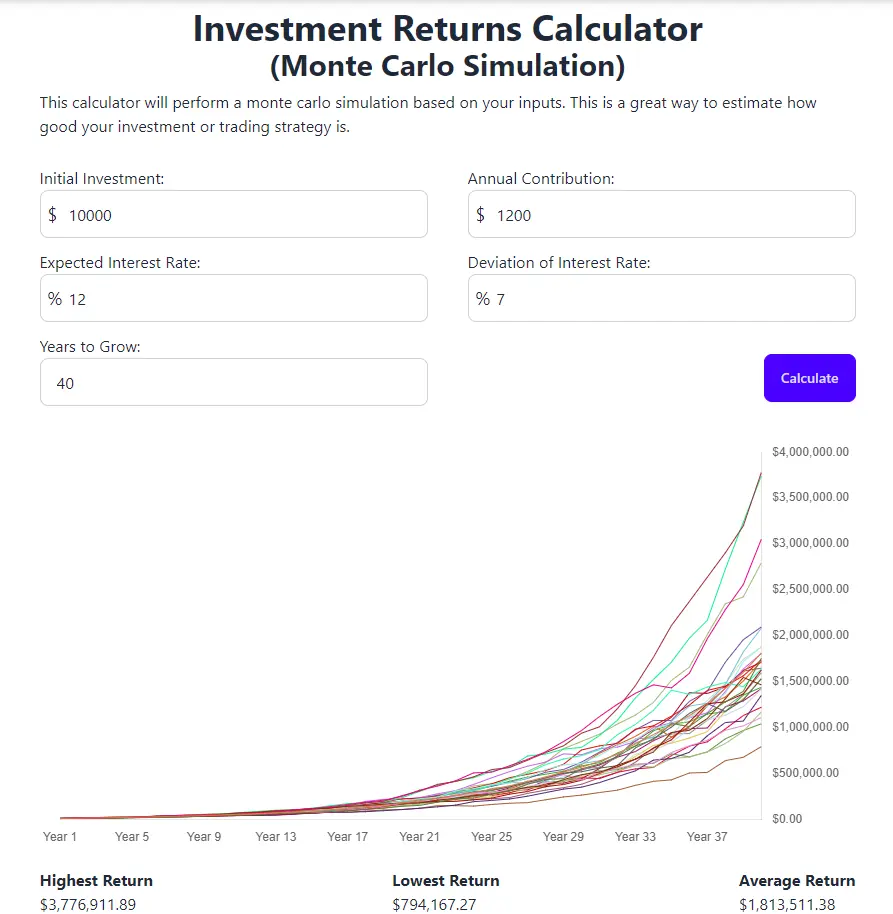
Can Prosperse help with long-term investment strategies?
Yes, Prosperse is versatile and caters to both short-term traders and long-term investors. You can use our stock screener to identify stocks with strong fundamentals, consistent earnings, and growth potential, helping you build a robust long-term portfolio.
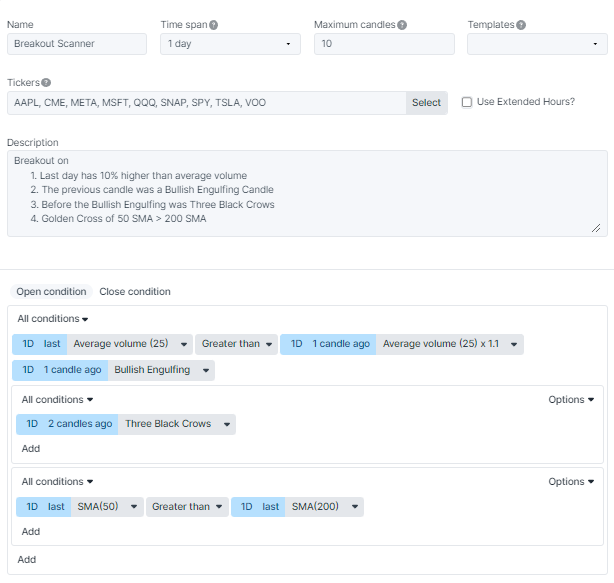
What types of filters can I use with Prosperse?
Prosperse allows you to filter stocks based on a wide range of criteria, including technical indicators, fundamental metrics, and more. This flexibility ensures you can tailor your search to find stocks that align with your specific trading or investment goals.
Is Prosperse suitable for beginner investors?
Yes, Prosperse is user-friendly and suitable for investors of all experience levels. Our intuitive interface, comprehensive tutorials, and responsive customer support make it easy for beginners to get started and take advantage of powerful stock screening tools.
How does Prosperse handle user data and privacy?
Prosperse takes user data and privacy seriously. We implement advanced security measures, including encryption and secure servers, to protect your personal information and ensure your data is handled with the utmost confidentiality.