Getting Started Building a Trading Career Tools and Resources Glossary - Backtesting
- Backtesting Depth
- Bear Market
- Bull Market
- Candlestick
- Charting
- Chart Patterns
- Day Trading
- Dividend Yield
- ETF
- Fundamental Analysis
- Leverage
- Limit Order
- Index Fund
- Margin Trading
- Market Capitalization
- Mutual Fund
- Market Trends
- Moving Averages
- Price-to-Earnings Ratio (P/E Ratio)
- Portfolio Diversification
- Positions in Prosperse
- Risk Management
- Scalping
- Short Selling
- Stock Alerts
- Stock Scanning
- Stock Screener
- Stop-Loss Order
- Support and Resistance
- Swing Trading
- Take Profit
- Technical Analysis
- Trend Lines
- Volatility
Glossary - Candlestick
Candlestick definition
A type of price chart that displays the high, low, open, and close prices of a security for a specific period.A candlestick is a type of price chart used in technical analysis that displays the high, low, open, and close prices of a security for a specific period. Each candlestick represents a single period of data, which can range from one minute to one month, or even longer.
- Open: The price at which the asset started trading during the period.
- Close: The price at which the asset finished trading during the period.
- High: The highest price the asset reached during the period.
- Low: The lowest price the asset reached during the period.
Candlesticks are essential tools for traders, offering insights into market sentiment and potential future price movements based on the visual representation of price action.
Use Cases
For example, a trader might use candlestick patterns like the "Doji" or "Hammer" to anticipate market reversals. A "Doji" candlestick, where the open and close prices are almost the same, may indicate market indecision and a possible trend reversal.
These patterns are crucial for traders who use technical analysis to make informed trading decisions.
Historical Context
Candlestick charting originated in Japan in the 18th century, used by rice traders to track market prices. Over time, this method spread to the West and became a staple in technical analysis, favored for its ability to convey complex information through simple visual patterns.
Today, candlestick charts are widely used in financial markets, with platforms like Prosperse providing advanced candlestick analysis tools that help traders identify patterns and make better trading decisions.
Visual Aid
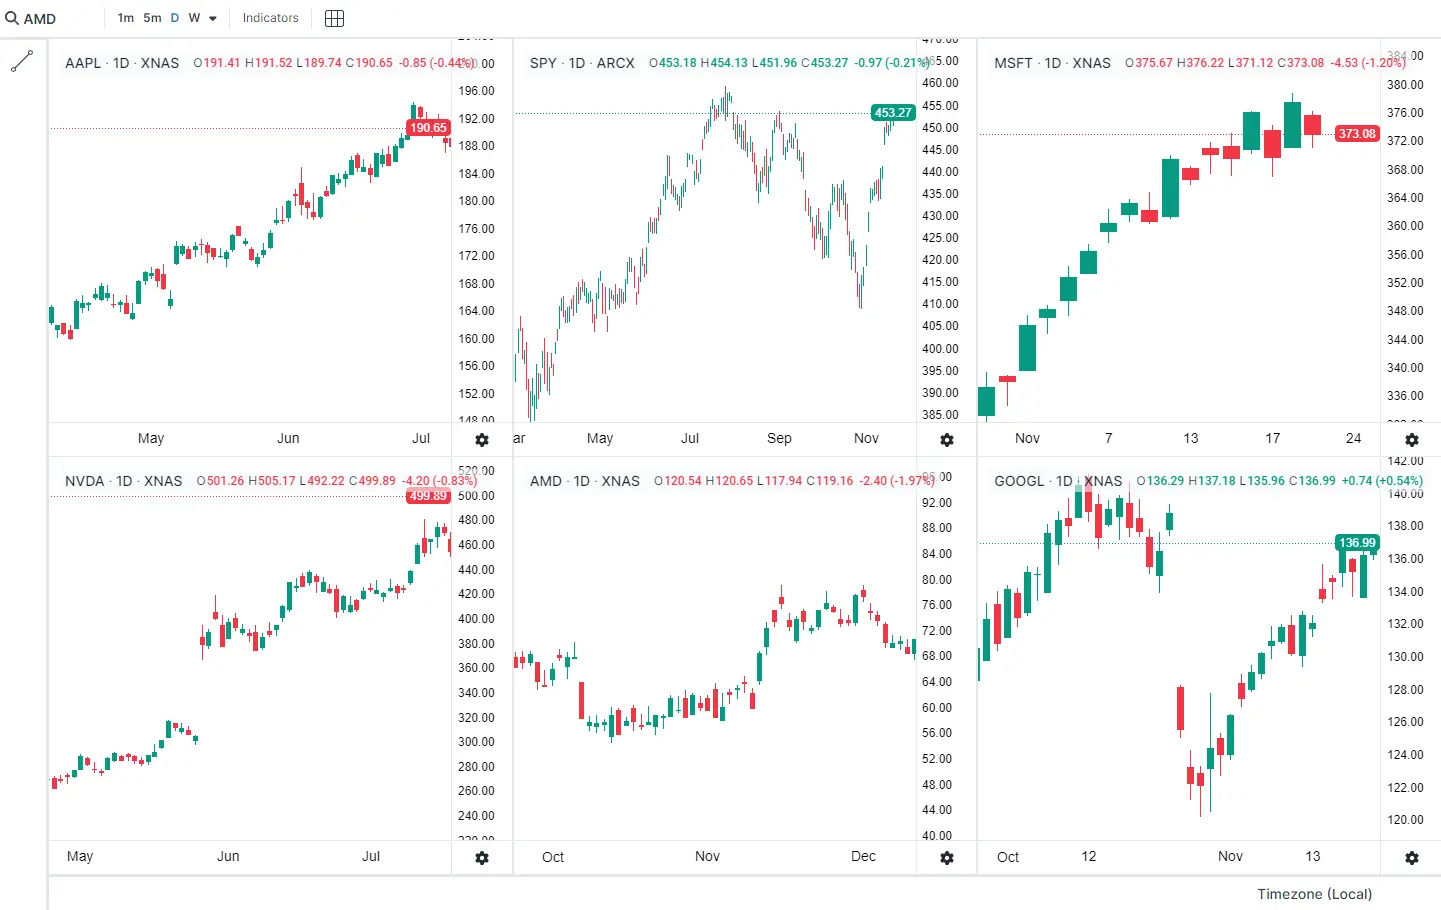
Below is an example of some candlestick charts.

Candlestick chart example
Related Terms:
- Charting: A method of tracking market prices using visual representations such as candlestick charts.
- Stock Alerts: Notifications that inform you of specific events related to a stock or the market.
Frequently Asked Questions
What is a candlestick in trading?
A candlestick is a type of price chart that displays the high, low, open, and close prices of a security for a specific period. It's a fundamental tool in technical analysis.
How do candlestick patterns help traders?
Candlestick patterns help traders by providing visual signals that indicate potential future price movements. Patterns like 'Doji' or 'Hammer' can suggest market indecision or potential reversals.
What are the key components of a candlestick?
The key components of a candlestick are the open, close, high, and low prices. These elements form the candlestick body and wicks, representing the price action within a specific period.
Can candlesticks be used in all financial markets?
Yes, candlesticks can be used in various financial markets, including stocks, forex, commodities, and cryptocurrencies. They are versatile tools applicable to different asset classes.
What are some common candlestick patterns?
Common candlestick patterns include Doji, Hammer, Bullish Engulfing, and Bearish Engulfing. These patterns are used by traders to identify potential trends and reversals.
Are candlestick charts reliable?
Candlestick charts are reliable for many traders, especially when used in conjunction with other technical analysis tools. However, like all trading tools, they should be used with caution and confirmation from other indicators.
How can I learn to read candlestick charts?
Learning to read candlestick charts involves understanding the basic components and studying common patterns. Many trading platforms, including Prosperse, offer resources and tools to help you get started.
What is the significance of the 'Doji' candlestick pattern?
The 'Doji' candlestick pattern occurs when the open and close prices are almost the same, indicating market indecision. It can be a signal for potential trend reversals, especially when found at the top or bottom of a trend.
