Getting Started Building a Trading Career Tools and Resources Glossary - Backtesting
- Backtesting Depth
- Bear Market
- Bull Market
- Candlestick
- Charting
- Chart Patterns
- Day Trading
- Dividend Yield
- ETF
- Fundamental Analysis
- Leverage
- Limit Order
- Index Fund
- Margin Trading
- Market Capitalization
- Mutual Fund
- Market Trends
- Moving Averages
- Price-to-Earnings Ratio (P/E Ratio)
- Portfolio Diversification
- Positions in Prosperse
- Risk Management
- Scalping
- Short Selling
- Stock Alerts
- Stock Scanning
- Stock Screener
- Stop-Loss Order
- Support and Resistance
- Swing Trading
- Take Profit
- Technical Analysis
- Trend Lines
- Volatility
Charting
In the realm of trading, charts are not just tools—they're the language of the markets. Understanding how to read and use trading charts is crucial for any trader's success. This will introduce you to the basics of charting, different methods, and interacting with your charts for the first time.
Understanding Trading Charts
Trading charts visually represent the price movements of financial instruments over time. They are essential for technical analysis, helping traders identify trends, patterns, and potential trading opportunities.
Benefits of Using Trading Charts
Trading charts are essential for technical analysis. They help traders identify trends, patterns, and potential trading opportunities.
Charts can help identify trends, patterns, and potential trading opportunities. They can also help traders identify support and resistance levels, which are price levels where the price of a financial instrument is more likely to reverse direction.
Types of Trading Charts
- Line Charts are the simplest type of trading chart. They are formed by connecting the closing prices of a financial instrument over a specified period of time.
Here is an example of a Line Chart:

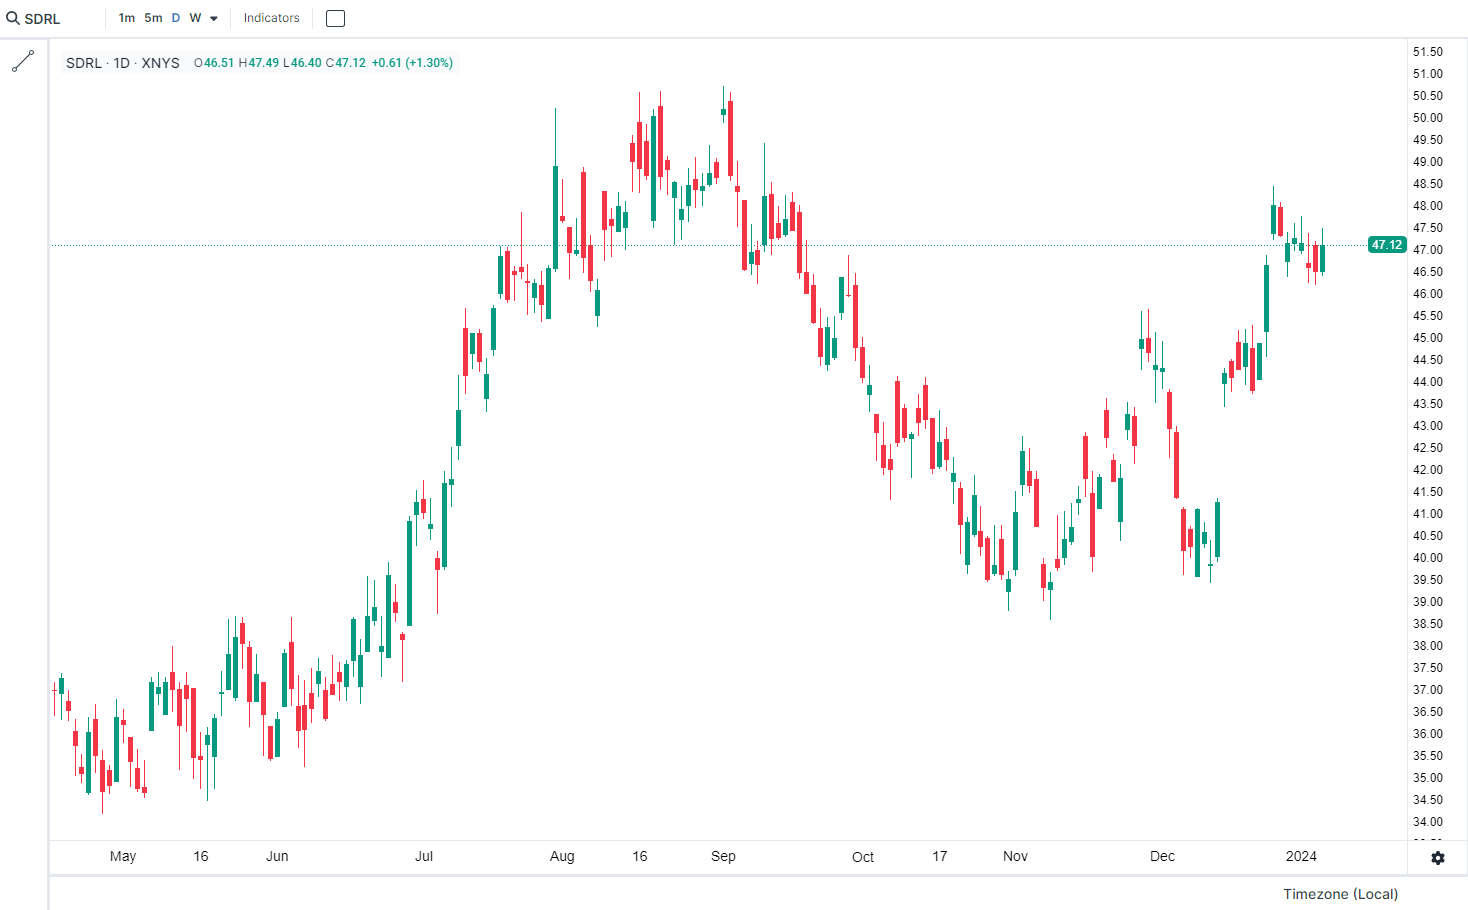
- Candlestick Charts are formed by connecting the high, low, open, and close prices of a financial instrument over a specified period of time. They are similar to bar charts, but they are easier to read and interpret. Candlestick charts are the most popular type of trading chart.
Here is an example of a Candlestick Chart:

There are other chart types, and they are all useful in their own way. However, line charts and candlestick charts are the most popular types of trading charts.
Chart Controls and Timeframe
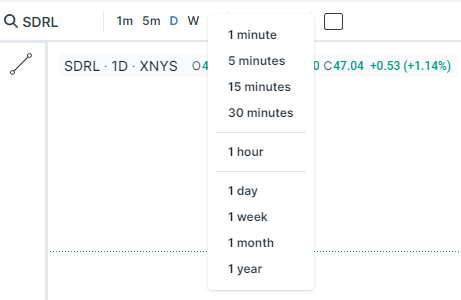
Charts usually come with methods of customizing the data displayed. For example, you can change the timeframe of a chart to display data for a different period of time. You can also add indicators to a chart to help you identify trends and patterns.
With Prosperse charts, you can change the timeframe of a chart by clicking on the timeframe buttons at the top of the chart. You can also add indicators to a chart by clicking on the indicators button at the top of the chart.

Drawing
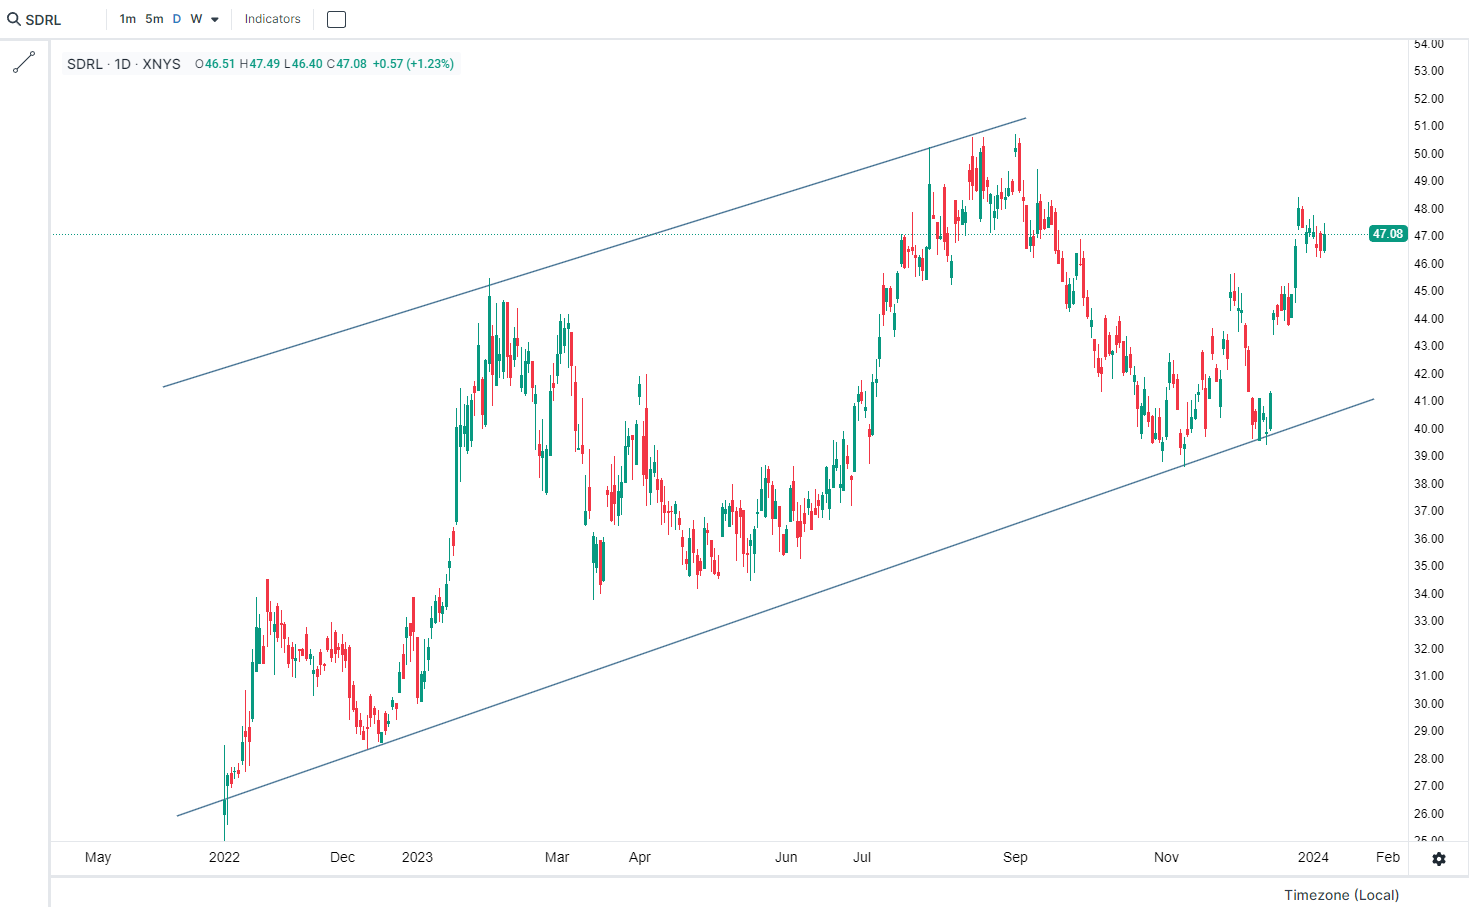
Many charts support drawing tools, which allow you to draw lines, shapes, and other objects on a chart. Drawing tools can be useful for identifying trends and patterns.
Prosperse charts support drawing tools. You can access the line tool by clicking the line icon on the left sidebar

