Getting Started Building a Trading Career Tools and Resources Glossary - Backtesting
- Backtesting Depth
- Bear Market
- Bull Market
- Candlestick
- Charting
- Chart Patterns
- Day Trading
- Dividend Yield
- ETF
- Fundamental Analysis
- Leverage
- Limit Order
- Index Fund
- Margin Trading
- Market Capitalization
- Mutual Fund
- Market Trends
- Moving Averages
- Price-to-Earnings Ratio (P/E Ratio)
- Portfolio Diversification
- Positions in Prosperse
- Risk Management
- Scalping
- Short Selling
- Stock Alerts
- Stock Scanning
- Stock Screener
- Stop-Loss Order
- Support and Resistance
- Swing Trading
- Take Profit
- Technical Analysis
- Trend Lines
- Volatility
Glossary - Technical Analysis
Technical Analysis definition
An analysis method that uses past price data and volume to predict future price movements.Technical analysis is a method of evaluating securities by analyzing statistical trends from trading activity, such as price movement and volume. It relies on historical data and chart patterns to forecast future price movements and make trading decisions.
Use Cases
Traders use technical analysis to identify patterns such as "head and shoulders," "double tops," or "flags," which may indicate potential price movements. For instance, a trader might identify a bullish "flag" pattern, signaling a continuation of an upward trend, and decide to buy the stock in anticipation of further gains.
Technical analysis is widely used in day trading, swing trading, and other short-term strategies where timing the market is crucial.
Historical Context
The origins of technical analysis can be traced back to the late 19th century with the work of Charles Dow, the founder of Dow Theory. Over time, it has evolved into a sophisticated approach, incorporating various indicators, oscillators, and charting techniques that are now standard tools for traders and analysts.
Prosperse offers a comprehensive suite of technical analysis tools, including advanced charting, indicators, and pattern recognition algorithms, enabling traders to analyze and interpret market data with precision.
Visual Aid
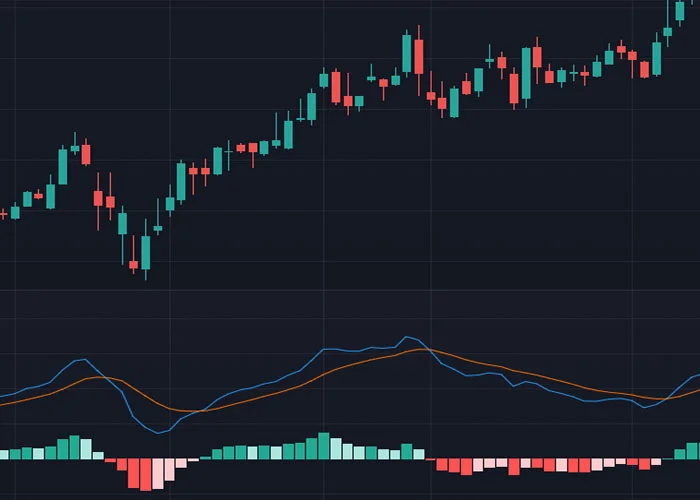
Below is an example of technical analysis in action, showing the identification of a MACD indicator being used

Understanding and identifying these patterns can help traders make more informed decisions and potentially predict future market movements.
Related Terms:
- Swing Trading: A trading strategy that involves holding positions for several days or weeks to capitalize on price swings.
- Candlestick: A type of price chart that displays the high, low, open, and close prices of a security for a specific period.
Frequently Asked Questions
What is technical analysis?
Technical analysis is a method of evaluating securities by analyzing statistical trends from trading activity, such as price movement and volume, to forecast future price movements.
How does technical analysis differ from fundamental analysis?
While fundamental analysis focuses on evaluating a company's financial health and intrinsic value, technical analysis is purely based on historical price and volume data to predict future price movements.
What are common tools used in technical analysis?
Common tools include charts (such as candlestick charts), indicators (like RSI and MACD), trend lines, and pattern recognition. These tools help traders identify potential market trends and make informed trading decisions.
Is technical analysis effective?
Technical analysis is widely used by traders and can be effective when combined with a solid trading strategy and risk management. However, it is not foolproof and should be used alongside other forms of analysis.
Can beginners use technical analysis?
Yes, beginners can start using technical analysis by learning the basics of chart patterns and indicators. Many trading platforms, including Prosperse, offer user-friendly tools and educational resources to help beginners get started.
What are the limitations of technical analysis?
Technical analysis relies on historical data, which may not always predict future movements accurately. It also doesn't account for fundamental factors like earnings reports, economic data, or geopolitical events, which can significantly impact prices.
What are some common chart patterns in technical analysis?
Common chart patterns include head and shoulders, double tops and bottoms, triangles, and flags. These patterns are used to predict potential reversals or continuations in the market.
How do I get started with technical analysis?
To get started, familiarize yourself with basic chart types and technical indicators. Practice analyzing historical price data and identifying patterns. Many platforms, including Prosperse, provide the tools needed to practice and refine your skills.
