Getting Started Building a Trading Career Tools and Resources Glossary - Backtesting
- Backtesting Depth
- Bear Market
- Bull Market
- Candlestick
- Charting
- Chart Patterns
- Day Trading
- Dividend Yield
- ETF
- Fundamental Analysis
- Leverage
- Limit Order
- Index Fund
- Margin Trading
- Market Capitalization
- Mutual Fund
- Market Trends
- Moving Averages
- Price-to-Earnings Ratio (P/E Ratio)
- Portfolio Diversification
- Positions in Prosperse
- Risk Management
- Scalping
- Short Selling
- Stock Alerts
- Stock Scanning
- Stock Screener
- Stop-Loss Order
- Support and Resistance
- Swing Trading
- Take Profit
- Technical Analysis
- Trend Lines
- Volatility
Glossary - Charting
Charting definition
A method of tracking market prices using visual representations such as candlestick charts.Candlestick charts are a type of financial chart used to describe price movements of an asset, derivative, or currency. Each candlestick typically shows one day, week, or month of data, including the open, high, low, and close prices.
- Open: The price at which the asset started trading during the time period.
- Close: The price at which the asset finished trading during the time period.
- High: The highest price the asset reached during the time period.
- Low: The lowest price the asset reached during the time period.
Candlestick charts are favored by traders for their clear and comprehensive visual format, making it easy to spot patterns and trends that might not be as obvious in other chart types.
Use Cases
Traders often use candlestick patterns to predict future price movements. For instance, a "Doji" candlestick pattern, where the open and close prices are almost identical, might indicate market indecision and a potential reversal.
Historical Context
Candlestick charting originated in Japan in the 18th century, used by rice traders to track market prices. Over time, this method spread to the West and became a staple in technical analysis. Today, candlestick charts are a fundamental tool for traders across the globe.
Modern trading platforms like Prosperse have enhanced candlestick charting by integrating it with other tools, such as moving averages and volume indicators, to provide traders with a more comprehensive analysis experience.
Visual Aid
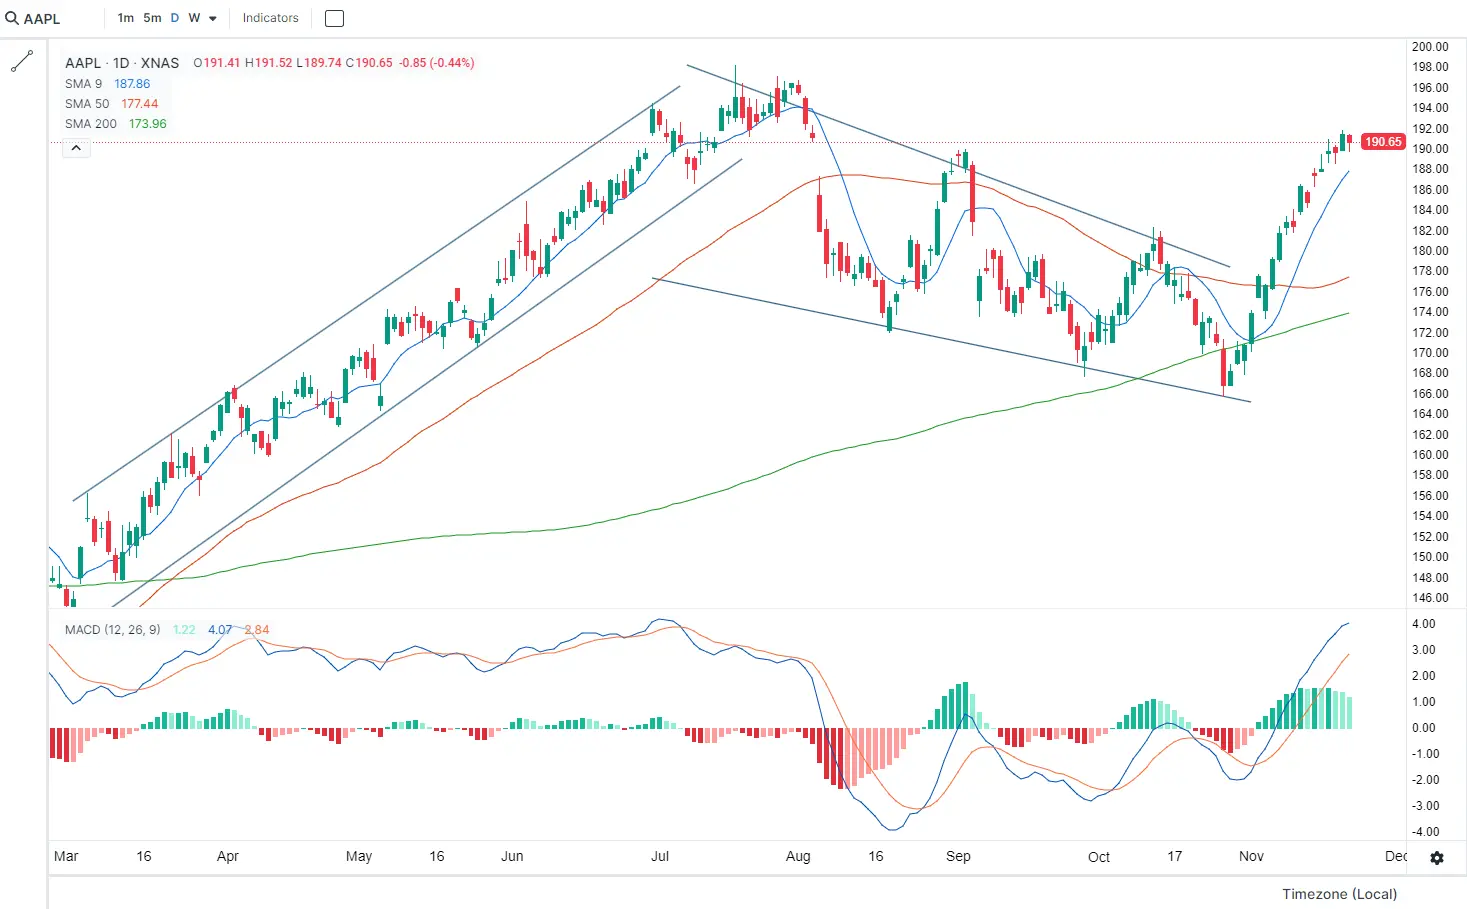
Below is an example of a candlestick chart showing a clear "Bullish Engulfing" pattern, often considered a buy signal.

Candlestick chart example showing indicators and patterns.
This chart highlights the bullish engulfing pattern, where a smaller bearish candle is followed by a larger bullish candle, indicating potential upward momentum.
Related Terms:
- Backtesting: A process used to test a trading strategy using historical data to see how it would have performed.
- Stock Screener: A tool that allows you to filter stocks based on specific criteria.
- Candlestick: A type of price chart that displays the high, low, open, and close prices of a security for a specific period.
Frequently Asked Questions
What is a candlestick chart?
A candlestick chart is a type of financial chart used to represent price movements of an asset, including the open, close, high, and low prices for a specific time period.
How do traders use candlestick charts?
Traders use candlestick charts to identify patterns and trends that can indicate future price movements. For example, patterns like 'Doji' or 'Hammer' can signal potential reversals in the market.
What are some common candlestick patterns?
Common candlestick patterns include Doji, Hammer, Bullish Engulfing, and Bearish Engulfing. Each of these patterns can provide traders with insights into market sentiment and potential price direction.
Can candlestick charts be used for all assets?
Yes, candlestick charts can be used for various assets, including stocks, commodities, forex, and cryptocurrencies. They are versatile and widely applicable in different markets.
Are candlestick charts reliable?
Candlestick charts are a reliable tool for many traders, but they should be used in conjunction with other technical analysis tools to confirm signals and minimize risk.
How can I learn to read candlestick charts?
Learning to read candlestick charts involves understanding the basic components (open, close, high, low) and studying common patterns. Many trading platforms, including Prosperse, offer educational resources to help you get started.
Do candlestick charts show volume data?
Candlestick charts primarily focus on price data, but they can be combined with volume indicators to provide a more comprehensive view of market activity.
What is the difference between a line chart and a candlestick chart?
A line chart displays only the closing prices over a period, while a candlestick chart shows the open, high, low, and close prices, providing a more detailed view of price movements within each time period.
How do I customize candlestick charts on Prosperse?
On Prosperse, you can customize candlestick charts by adjusting time frames, adding technical indicators, and changing chart styles to suit your analysis needs.
