Getting Started Building a Trading Career Tools and Resources Glossary - Backtesting
- Backtesting Depth
- Bear Market
- Bull Market
- Candlestick
- Charting
- Chart Patterns
- Day Trading
- Dividend Yield
- ETF
- Fundamental Analysis
- Leverage
- Limit Order
- Index Fund
- Margin Trading
- Market Capitalization
- Mutual Fund
- Market Trends
- Moving Averages
- Price-to-Earnings Ratio (P/E Ratio)
- Portfolio Diversification
- Positions in Prosperse
- Risk Management
- Scalping
- Short Selling
- Stock Alerts
- Stock Scanning
- Stock Screener
- Stop-Loss Order
- Support and Resistance
- Swing Trading
- Take Profit
- Technical Analysis
- Trend Lines
- Volatility
Glossary - Moving Averages
Moving Averages definition
A technical analysis tool that smooths out price data to identify trends over a specific period.Moving averages (MA) are commonly used indicators in technical analysis to smooth out price data and identify trends. They calculate the average price of an asset over a specific time period, such as 50, 100, or 200 days, making it easier to determine market direction.
Use Cases
Moving averages are widely used by traders to identify potential buy or sell signals. For example, when the price of a stock crosses above its 200-day moving average, it may indicate an uptrend, while crossing below it might suggest a downtrend. Traders often use multiple MAs, like combining short-term and long-term averages, to confirm trends.
Historical Context
Moving averages have been a core component of technical analysis since the early 20th century. The concept became popular as markets grew more complex, and traders sought more systematic ways to analyze price movements. The exponential moving average (EMA), a variation that gives more weight to recent prices, was later introduced to respond more effectively to recent data changes.
Visual Aid
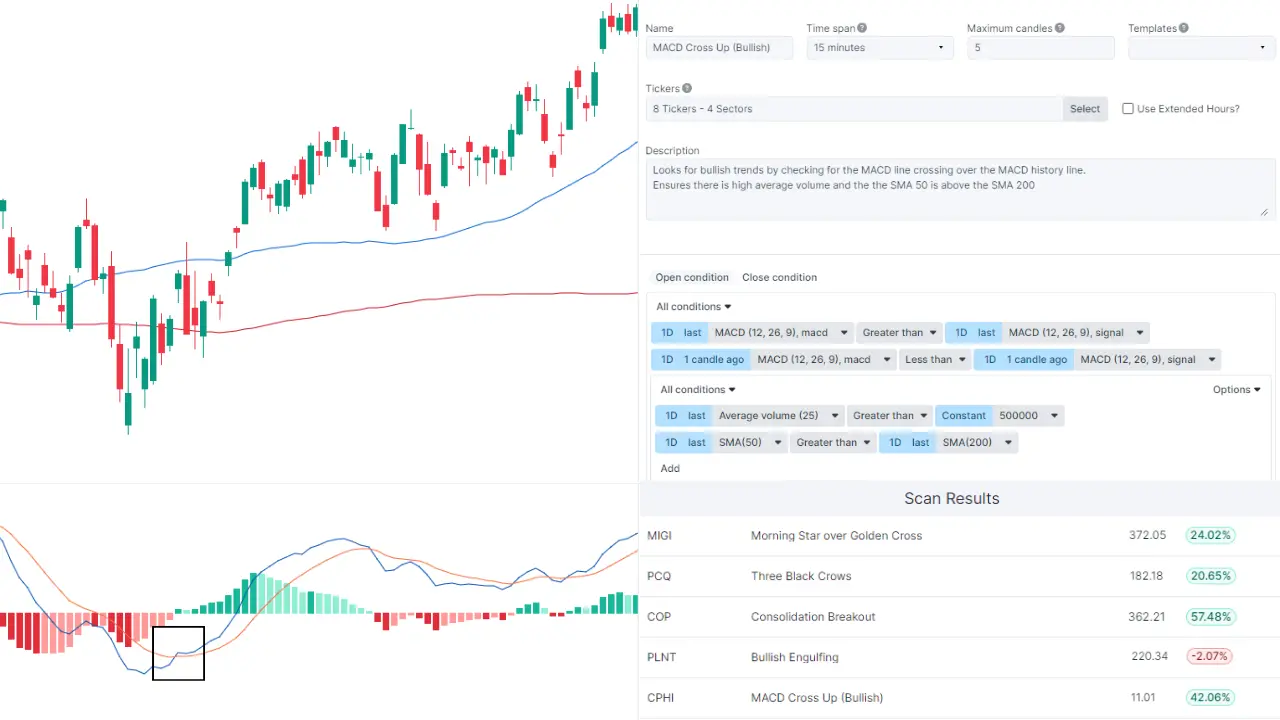
The image below illustrates a stock chart with 50-day and 200-day moving averages. The 50-day moving average reacts faster to price changes, while the 200-day moving average provides a smoother, long-term trend indicator.

Related Terms:
- Technical Analysis: An analysis method that uses past price data and volume to predict future price movements.
- Trend Lines: Diagonal lines drawn on a price chart to represent the direction of price movements.
Frequently Asked Questions
What are moving averages in technical analysis?
Moving averages are statistical tools used in technical analysis to smooth out price data and identify trends. They show the average price of an asset over a specific period, helping traders spot trends and potential reversal points.
What are the different types of moving averages?
The two most common types of moving averages are the simple moving average (SMA), which equally weights all prices, and the exponential moving average (EMA), which gives more weight to recent prices. Traders use both to assess market direction.
How do moving averages help in trading?
Moving averages help traders identify the trend of a stock or market. For example, a short-term moving average crossing above a long-term one might signal a buying opportunity. Similarly, a downward cross may suggest a selling point.
